
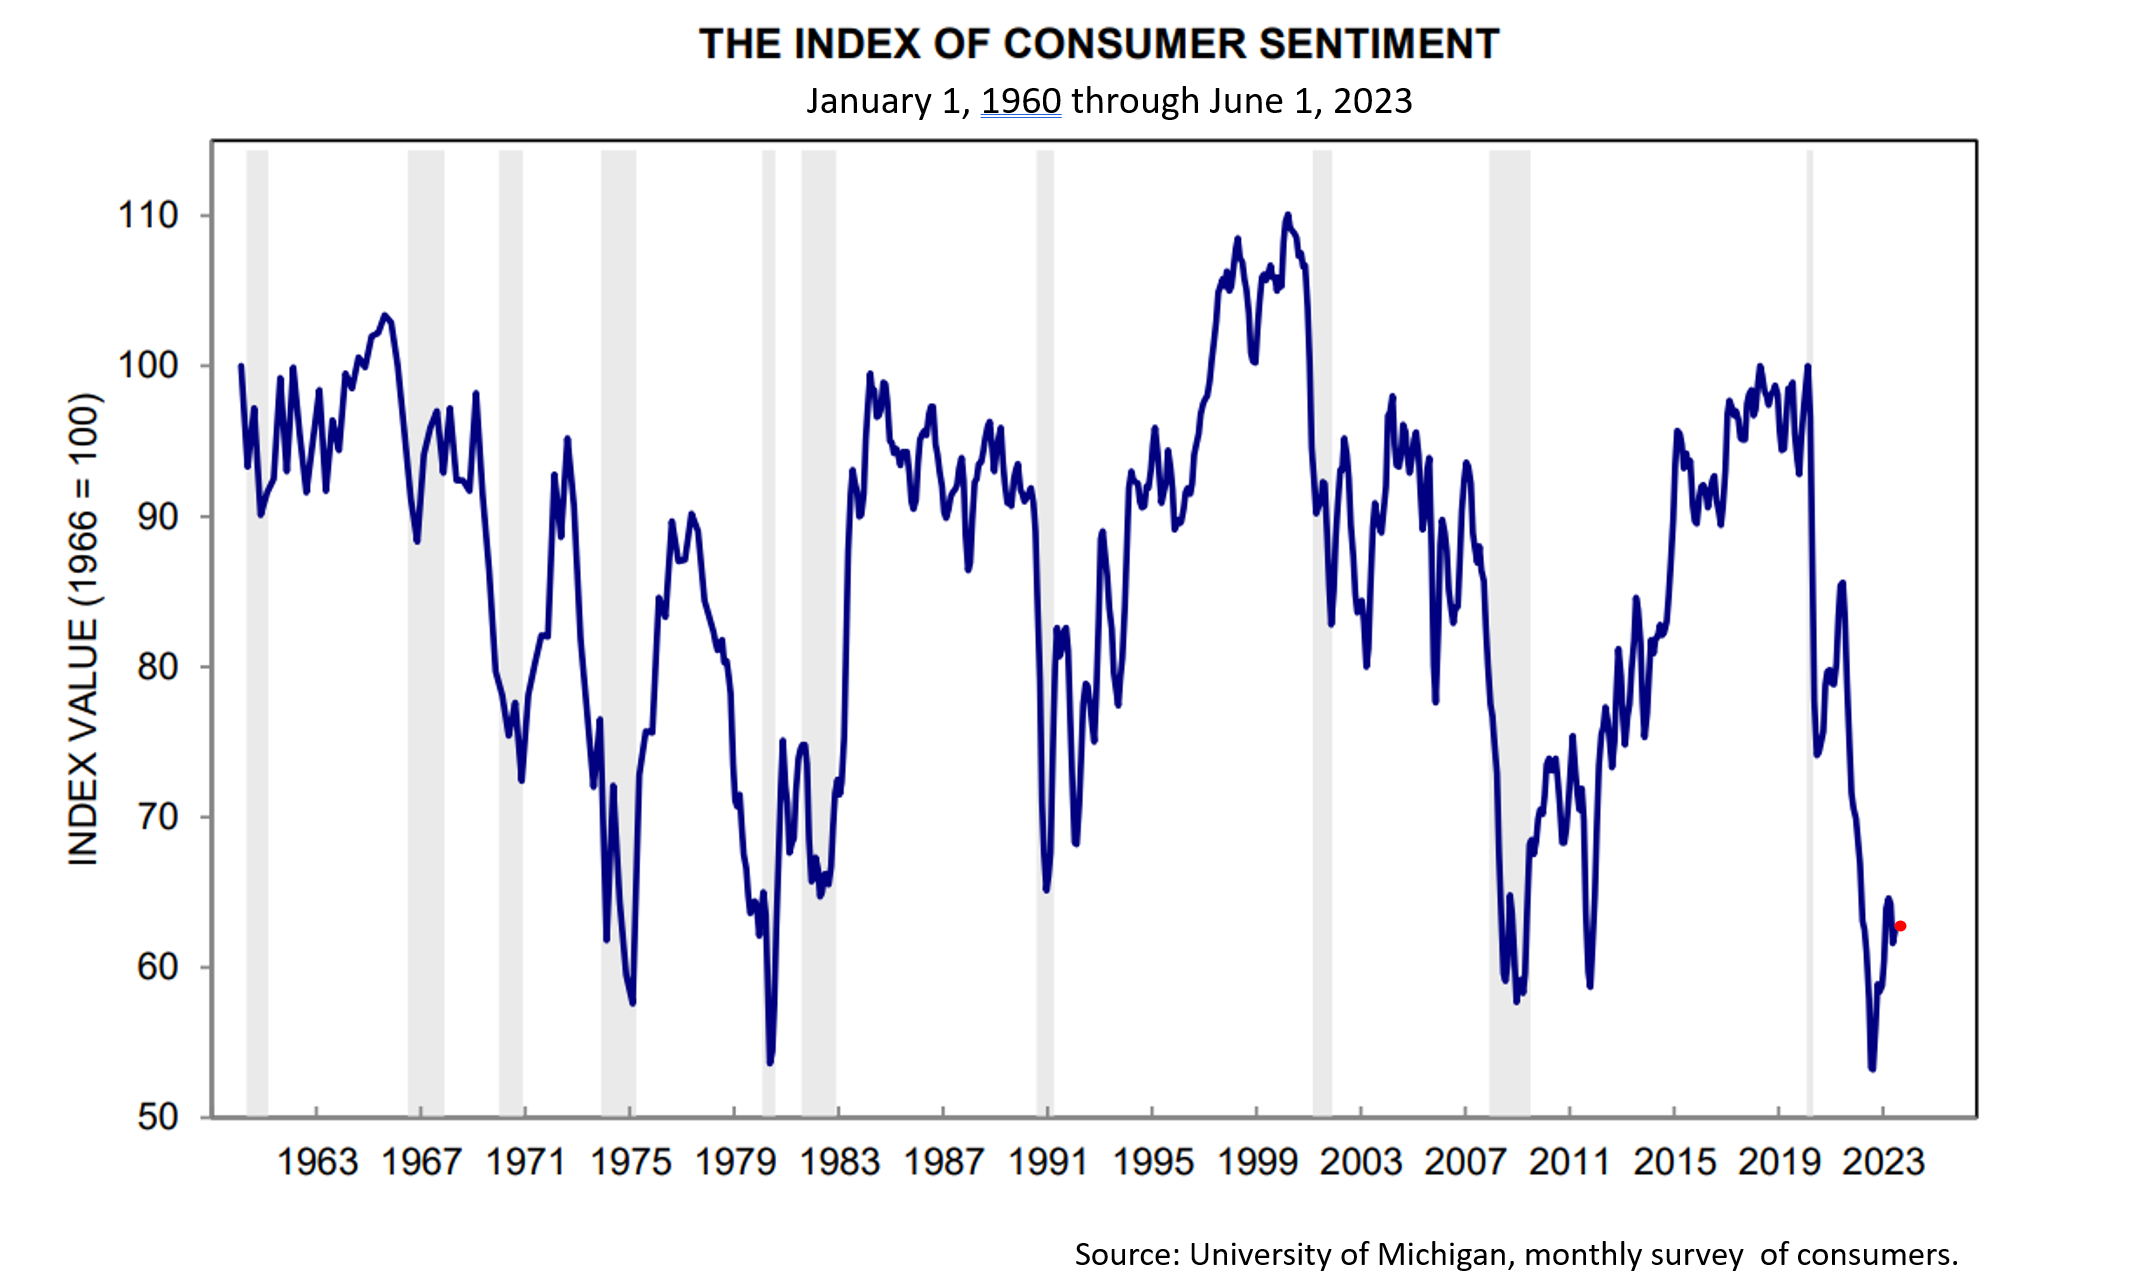
A recession is expected to begin within nine months by 61% of economists, according to the latest survey of economists by The Wall Street Journal in early April, and consumer sentiment is not far above its low point since the University of Michigan began its monthly survey in 1960. Only 19% of Americans say they are satisfied with the way things are going in the country, while 80% are dissatisfied, according to a survey released in April by Pew Research Center.
The future always looks bleak. Consider this: In 1973 and 1974, the stock market crashed and, in a recession from 1973 to 1975, 2.3 million jobs were lost -- a post-war record. President Richard Nixon resigned in August 1974 and Saigon fell in April 1975. Yet 1975 to 1999 was the best 25-year period of the last 53 years for investors in a diversified portfolio.
“It’s always easy to find things to be pessimistic about,” says Craig Israelsen, Ph.D., a university professor who has taught, thought, and written about investing for over 40 years. “There’s always something to worry about.”
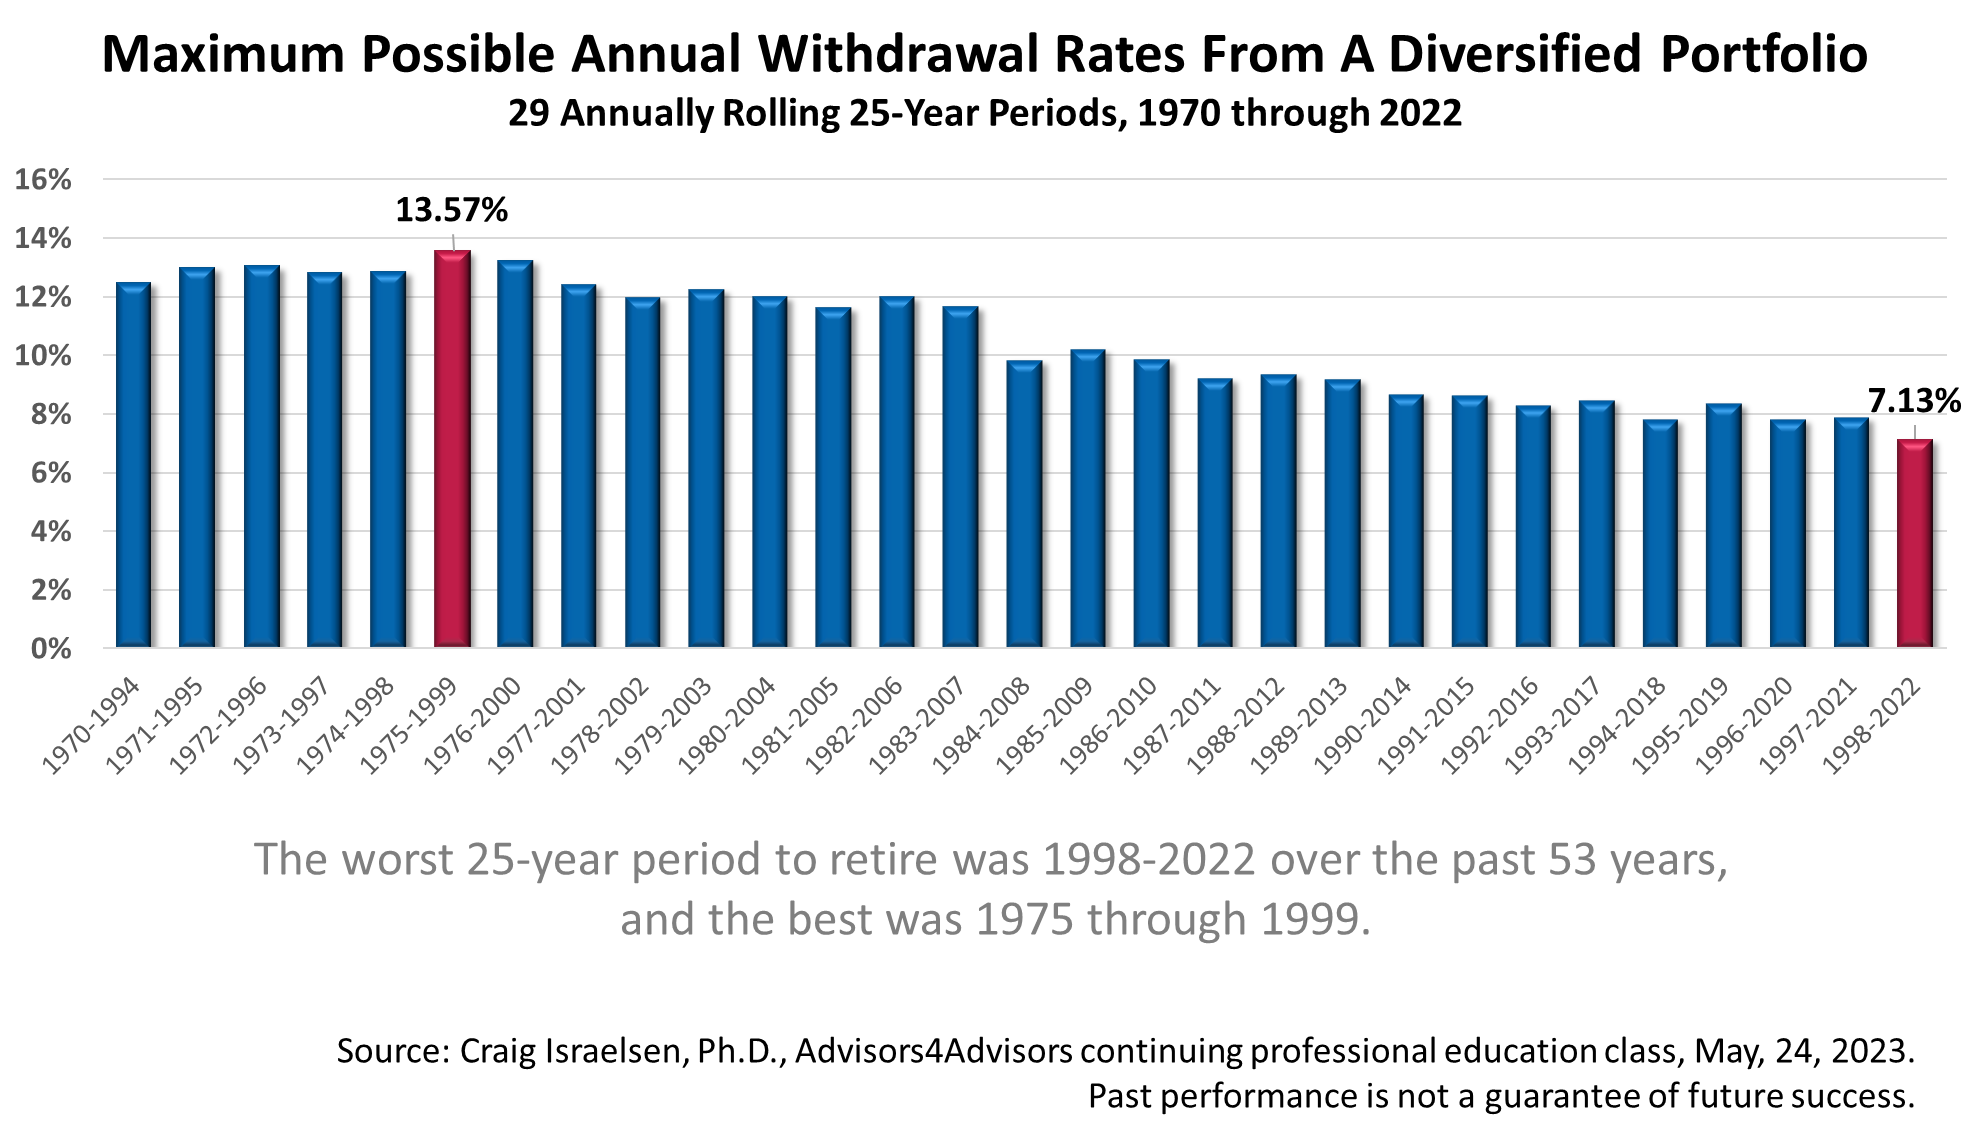
Dr. Israelsen says investors are overly influenced by recent events, a perspective that sees trees but misses the forest. His analysis of the best and worst 25-year rolling returns on a diversified portfolio over the past half-century is summarized in the bar chart above.
Each blue bar represents the maximum amount that could have been withdrawn annually from a diversified portfolio while still leaving half of the portfolio’s starting amount after 25 years. Think of each blue bar as a retiree.
The best time to retire in the past 53 calendar years was in January 1975. A retiree who was 65 in 1975 and lived until age 90 in 1999, would have been able to withdraw as much as 13.57% of their portfolio annually for income to live on and would still have had 50% of their portfolio to pass on to heirs.
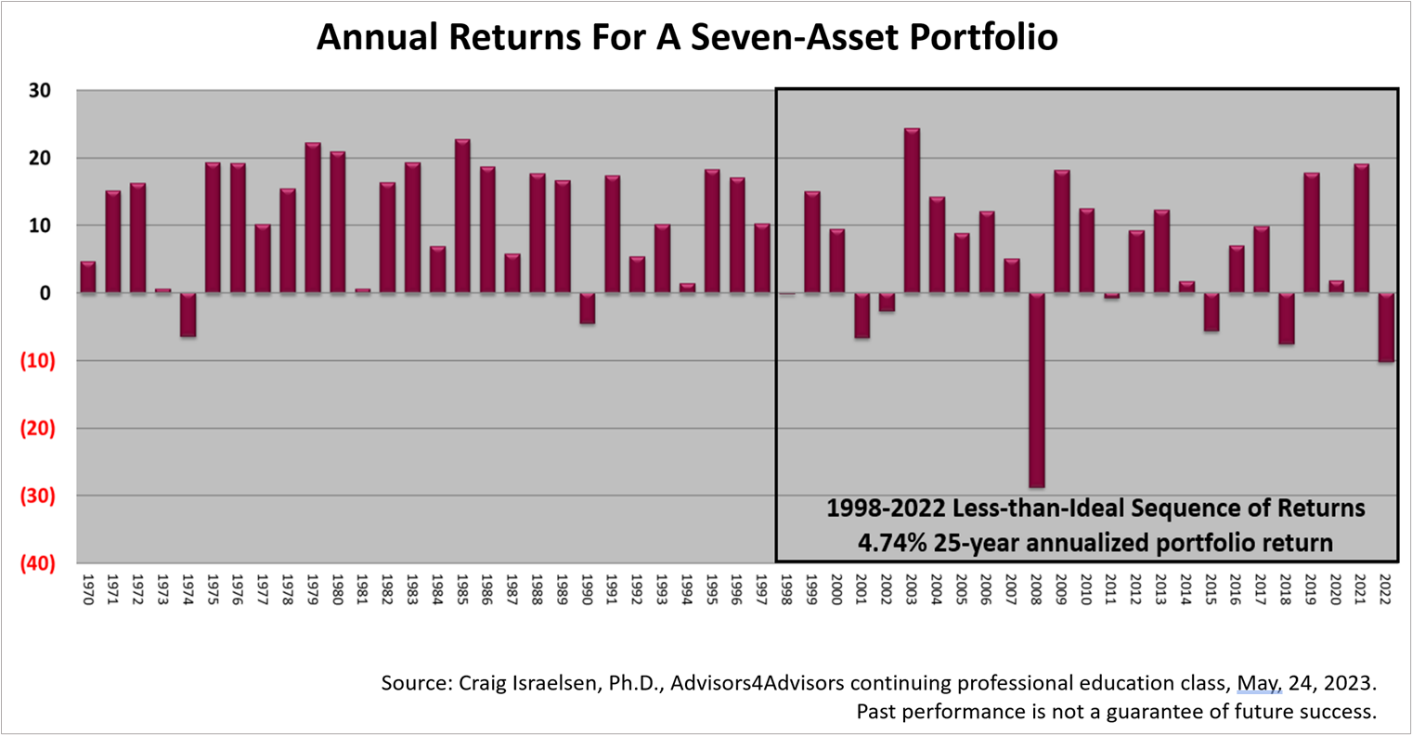
The worst time to retire over the 53 years, according to the analysis, was the 25-year period from 1998 through the end of 2022. The chart above shows the bad sequence of returns on a diversified portfolio over the 25-year period that ended in 2022. With more losing years – including the tech crash of 2001-2002, the mortgage debt crisis in 2008, and the post-pandemic bear market of 2022 -- a retiree could have withdrawn a maximum annually from a diversified portfolio of 7.13% and still have had 50% of the starting amount of their portfolio to pass on to heirs. And that was the worst sequence of the 53 rolling 25-year periods!
In terms of dollars of income before taxation, between 1975 and 1999, a $500,000 retirement portfolio was able to sustain average annual withdrawals of $66,533, at a rate of 13.57%, and hold a balance of $250,000 at the end of 1999. Meanwhile, between 1998 and 2022, a $500,000 retirement portfolio was able to sustain annual average withdrawals of $29,081, a 7.13% annual rate, according to Dr. Israelsen, and retain a balance of $250,000 at the end of 25 years in 2022.
“I can't emphasize enough, the importance of persistence and patience and staying with it,” says Dr. Israelsen. “Just like you would with a child that's having a struggle, a spouse with health issues, you name it, just stay with it. Keep on marching, and don't get distracted by fear.
“It's okay to be cautious,” Dr. Israelsen said at a continuing education class for financial professionals, “but to live in a state of fear is hardly living.”
The returns in the two figures above were net of a 1% annual expense fee. The diversified portfolio used in this analysis was rebalanced annually to maintain their equal weightings in seven asset classes:
- Large-cap US equity represented by the S&P 500 Index from 1970-2022.
- Small-cap US equity is represented by the Ibbotson Small Companies Index from 1970-1978 and the Russell 2000 Index from 1979-2022.
- Non-US equity represented by the MSCI EAFE Index from 1970-2022.
- Real estate represented by the NAREIT Index from 1972-1977 and the Dow Jones US Select REIT Index from 1978-2022. The 1970 and 1971 returns from research by Chan, Erickson, and Wang in “Real Estate Investment Trusts: Structure, Performance, and Investment Opportunities,” Table 2.2).
- Commodities represented by the Goldman Sachs Commodities Index (GSCI) from 1970-2022. As of February 6, 2007, the GSCI became the S&P GSCI Commodity Index.
- S. Aggregate Bonds represented by the Ibbotson Intermediate Term Bond Index from 1970-75 and the Bloomberg Aggregate Bond Index from 1976-2022.
- Cash represented by 3-month Treasury Bills from 1970-2022.